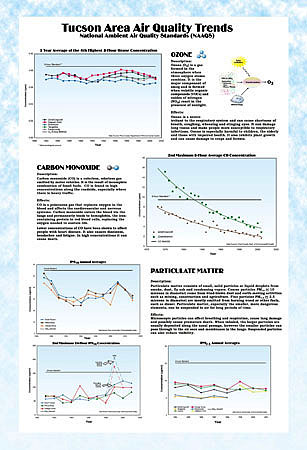
DESCRIPTION: Chart of air quality graphs -- The graphs in this poster are updated each year. The text, a brief description of ozone, carbon dioxide, and particulate matter and how it affects you, remains the same. The poster can be printed as 11 x 17 handouts.