Graphics / RTA Flowchart
pat@ptamarin.com
DESCRIPTION:
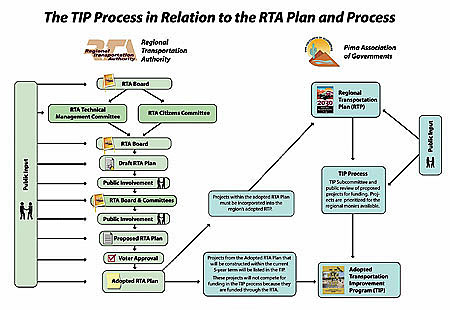
Flowchart showing how the Transportation Improvement Program at PAG ties into the Regional Transportation Plan
1
|
2
| 3 |
4
|
5
|
6
|
7
|
8
|
9
|
10
|
11
|
12
|
13
|
14
|
15
|
16
|
17
|
18
|
19
|
20
<
HOME
>